

- National Homes Prices Almost 50 Percent Higher Than March 2011 Bottom
- Four of the Top 10 Markets Considered Overvalued
- Unsold Housing Inventory is Lowest for Any Q2 in Over 30 Years
- Tight Inventory Driving Out Affordability
IRVINE, Calif. — (BUSINESS WIRE) — August 1, 2017 — CoreLogic® (NYSE: CLGX), a leading global property information, analytics and data-enabled solutions provider, today released its CoreLogic Home Price Index (HPI™) and HPI Forecast™ for June 2017 which shows home prices are up strongly both year over year and month over month. Home prices nationally increased year over year by 6.7 percent from June 2016 to June 2017, and on a month-over-month basis, home prices increased by 1.1 percent in June 2017 compared with May 2017,* according to the CoreLogic HPI.
This Smart News Release features multimedia. View the full release here: http://www.businesswire.com/news/home/20170801005635/en/
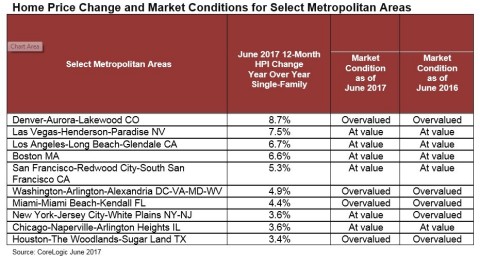
CoreLogic Home Price Change and Market Conditions for Select Metropolitan Areas
Looking ahead, the CoreLogic HPI Forecast indicates that home prices will increase by 5.2 percent on a year-over-year basis from June 2017 to June 2018, and on a month-over-month basis home prices are expected to increase by 0.6 percent from June 2017 to July 2017. The CoreLogic HPI Forecast is a projection of home prices using the CoreLogic HPI and other economic variables. Values are derived from state-level forecasts by weighting indices according to the number of owner-occupied households for each state.
“The growth in sales is slowing down, and this is not due to lack of affordability, but rather a lack of inventory,” said Dr. Frank Nothaft, chief economist for CoreLogic. “As of Q2 2017, the unsold inventory as a share of all households is 1.9 percent, which is the lowest Q2 reading in over 30 years.”
Of the nation’s 10 largest metropolitan areas measured by population, four were overvalued in June according to CoreLogic Market Conditions Indicators (MCI) data. These four metros include Denver-Aurora-Lakewood, CO, Houston-The Woodlands-Sugar Land, TX, Miami-Miami Beach-Kendall, FL and Washington-Arlington-Alexandria, DC-VA-MD-WV. By comparing home prices to their long-run, sustainable levels, which are supported by local market fundamentals such as disposable income, the MCI categorizes home prices in individual markets as undervalued, at value or overvalued. Because most homeowners use their income to pay for home mortgages, there is an established relationship between income levels and home prices. The MCI defines an overvalued market as one in which home prices are at least 10 percent higher than the long-term, sustainable level, while an undervalued market is one in which home prices are at least 10 percent below the sustainable level.
“Home prices are marching ever higher, up almost 50 percent since the trough in March 2011. With no end to the escalation in sight, affordability is rapidly deteriorating nationally and especially in some key markets such as Denver, Houston, Miami and Washington,” said Frank Martell, president and CEO of CoreLogic. “While low mortgage rates are keeping the market affordable from a monthly payment perspective, affordability will likely become a much bigger challenge in the years ahead until the industry resolves the housing supply challenge.”
Methodology
The CoreLogic HPI™ is built on industry-leading public record, servicing and securities real-estate databases and incorporates more than 40 years of repeat-sales transactions for analyzing home price trends. Generally released on the first Tuesday of each month with an average five-week lag, the CoreLogic HPI is designed to provide an early indication of home price trends by market segment and for the “Single-Family Combined” tier representing the most comprehensive set of properties, including all sales for single-family attached and single-family detached properties. The indexes are fully revised with each release and employ techniques to signal turning points sooner. The CoreLogic HPI provides measures for multiple market segments, referred to as tiers, based on property type, price, time between sales, loan type (conforming vs. non-conforming) and distressed sales. Broad national coverage is available from the national level down to ZIP Code, including non-disclosure states.
CoreLogic HPI Forecasts™ are
based on a two-stage, error-correction econometric model that combines
the equilibrium home price—as a function of real disposable income per
capita—with short-run fluctuations caused by market momentum,
mean-reversion, and exogenous economic shocks like changes in the
unemployment rate. With a 30-year forecast horizon, CoreLogic HPI
Forecasts project CoreLogic HPI levels for two tiers—“Single-Family
Combined” (both attached and detached) and “Single-Family Combined
Excluding Distressed Sales.” As a companion to the CoreLogic HPI
Forecasts, Stress-Testing Scenarios align with Comprehensive Capital
Analysis and Review (CCAR) national scenarios to project five years of
home prices under baseline, adverse and severely adverse scenarios at
state, Core Based Statistical Area (CBSA) and ZIP Code levels. The
forecast accuracy represents a 95-percent statistical confidence
interval with a +/- 2.0 percent margin of error for the index.