

—Credit Risk for New Loans in 2017 Similar to Loans Issued in Early 2000s—
- Mortgage Loans Exhibit Higher Credit Quality Since the Great Recession
- Purchase-Loan Risk Up Year Over Year Due to High Investor Share
- Refinance-Loan Risk Up Year Over Year Due to Lower Credit Scores and Higher DTI
IRVINE, Calif. — (BUSINESS WIRE) — December 19, 2017 — CoreLogic® (NYSE: CLGX), a leading global property information, analytics and data-enabled solutions provider, today released its Q3 2017 CoreLogic Housing Credit Index (HCI™) which measures trends in six home mortgage credit risk attributes. The HCI indicates the relative increase or decrease in credit risk for new home loan originations compared to prior periods. The six attributes include borrower credit score, debt-to-income ratio (DTI), loan-to-value ratio (LTV), investor-owned status, condo/co-op share and documentation level.
This press release features multimedia. View the full release here: http://www.businesswire.com/news/home/20171219005283/en/
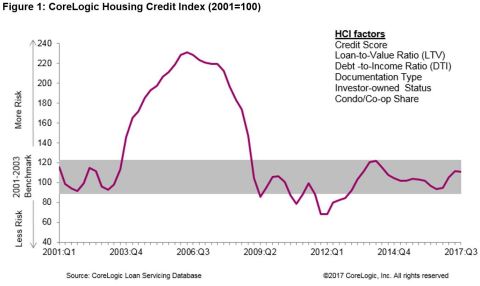
Figure 1: CoreLogic Housing Credit Index, Q3 2017 (Graphic: Business Wire)
In Q3 2017, the HCI increased to 111.1, up 18 points from 93.1 in Q3 2016. Even with this increase, credit risk in Q3 2017 is still within the benchmark range of the HCI. The benchmark range of 90 to 121 is measured as within one standard deviation of the average HCI value for 2001-2003, considered to be the normal baseline for credit risk. The increase in the credit risk, as measured by the HCI during the past year, was partly due to a shift in the purchase-loan mix to more investor loans and to a shift in the refinance-loan mix to borrowers with lower credit scores and higher DTI. This trend for refinance loans may reflect the rise in the FHA-to-conventional share of refinance activity.
“The CoreLogic Housing Credit Index is up compared to a year ago, in part reflecting a shift in the mix of loans to the purchase market, which typically exhibit higher risk,” said Dr. Frank Nothaft, chief economist for CoreLogic. “Further, the Index shows higher risk attributes for both purchase and refinance loans, although the risk levels still remain similar to the early 2000s. When looking at the two most recent quarters in which the mix of purchase and refinance loans were similar, the CoreLogic Housing Credit Index for each segment remained stable. Looking forward to 2018, with continuing economic and home price growth, we expect credit-risk metrics to rise modestly.”
HCI highlights for the six Index attributes for Q3 2017:
- Credit Score: The average credit score for homebuyers increased 7 points year over year between Q3 2016 and Q3 2017, rising from 739 to 746. In Q3 2017, the share of homebuyers with credit scores under 640 was 2 percent compared with 25 percent in 2001. In other words, the Q3 2017 share was less than one-tenth of the share in 2001.
- Debt-to-Income: The average DTI for homebuyers in Q3 2017 was unchanged from Q3 2016 at 36. In Q3 2017, the share of homebuyers with DTIs greater than or equal to 43 percent was 22 percent, down slightly from 24 percent in Q3 2016, but up from 18 percent in 2001.
- Loan-to-Value: The LTV for homebuyers dropped by almost 2 percentage points year over year, down from 86.4 percent in Q3 2016 to 84.9 percent in Q3 2017. In Q3 2017, the share of homebuyers with an LTV greater than or equal to 95 percent had increased by almost one-third compared with 2001.
- Investor Share: The investor share of home-purchase loans increased slightly from 4 percent in Q3 2016 to 4.4 percent in Q3 2017.
- Condo/Co-op Share: The share of home-purchase loans secured by a condominium or co-op building increased from 10 percent in Q3 2016 to 11.5 percent in Q3 2017.
- Documentation Type: Low- or no-documentation loans remained a small part of the mortgage market in Q3 2017, increasing from 1.5 percent to 2.2 percent of home-purchase loans during the past year.
For ongoing housing trends and data, visit the CoreLogic Insights Blog: http://www.corelogic.com/blog.
Methodology
The CoreLogic Housing Credit Index (HCI) measures the variation in
mortgage credit risk attributes and uses loan attributes from mortgage
loan servicing data that are combined in a principal component analysis
(PCA) model. PCA can be used to reduce a complex data set (e.g.,
mortgage loan characteristics) to a lower dimension to reveal properties
that underlie the data set.