

Highlights for fourth quarter 2023 include:
- Consolidated revenue of $1.48 billion, a 13% increase compared to the prior year quarter
- Gross margin expanded to 58.3% from 57.0% in the prior year quarter
- Operating margin was 23.0% compared to 20.5% in the prior year quarter
- Operating income was $340 million, a 27% increase compared to the prior year quarter
- GAAP EPS of $2.82 and pro forma EPS(1) of $1.72, representing 27% growth in pro forma EPS over the prior year quarter
- Received six Innovation Awards at the 2024 Consumer Electronics Show for our Venu® 3, epixTM Pro, MARQ® Golfer-Carbon Edition and Garmin's Autoland retrofit
- Launched the Descent TM G1 Solar-Ocean Edition, our first-ever product made with recycled ocean-bound plastics
- G3000® Integrated Flight Deck was selected by Eve Air Mobility for its electric vertical takeoff and landing aircraft
- Force® Kraken was selected for a Marine Power Innovation Award by the editors at Boating Magazine
- Awarded a multi-year Auto OEM contract that expands our customer base within domain controllers with production starting in 2027
- Garmin ranked No. 1 for the 20th consecutive year in Professional Pilot's 2024 Avionics Manufacturers Product Support Survey
- Garmin ranked No. 2 on Forbes' 2024 list of America's Best Large Employers
Highlights for fiscal year 2023 include:
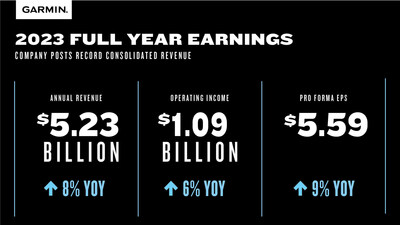
- Record consolidated revenue of $5.23 billion, an 8% increase compared to the prior year
- Aviation, Marine and Auto OEM segments each posted record full year revenue
- Gross margin of 57.5% compared to 57.7% in the prior year
- Operating margin of 20.9% compared to 21.1% in the prior year
- Operating income of $1.09 billion, a 6% increase compared to the prior year
- GAAP EPS of $6.71 and pro forma EPS(1) of $5.59, representing 9% growth in pro forma EPS over the prior year
(In thousands, except per share information) |
| 13-Weeks
|
|
| 14-Weeks
|
|
|
|
|
|
| 52-Weeks
|
|
| 53-Weeks
|
|
|
|
|
| ||||
|
|
| December 30, |
|
| December 31, |
|
| YoY |
|
| December 30, |
|
| December 31, |
|
| YoY |
| ||||||
|
|
| 2023 |
|
| 2022 |
|
| Change |
|
| 2023 |
|
| 2022 |
|
| Change |
| ||||||
| Net sales |
| $ | 1,482,501 |
|
| $ | 1,306,356 |
|
|
| 13 | % |
| $ | 5,228,252 |
|
| $ | 4,860,286 |
|
|
| 8 | % |
| Fitness |
|
| 412,076 |
|
|
| 336,553 |
|
|
| 22 | % |
|
| 1,344,637 |
|
|
| 1,109,419 |
|
|
| 21 | % |
| Outdoor |
|
| 486,378 |
|
|
| 451,465 |
|
|
| 8 | % |
|
| 1,697,151 |
|
|
| 1,770,275 |
|
|
| (4) | % |
| Aviation |
|
| 217,134 |
|
|
| 225,251 |
|
|
| (4) | % |
|
| 846,329 |
|
|
| 792,799 |
|
|
| 7 | % |
| Marine |
|
| 239,886 |
|
|
| 210,614 |
|
|
| 14 | % |
|
| 916,911 |
|
|
| 903,983 |
|
|
| 1 | % |
| Auto OEM |
|
| 127,027 |
|
|
| 82,473 |
|
|
| 54 | % |
|
| 423,224 |
|
|
| 283,810 |
|
|
| 49 | % |
|
|
|
|
|
|
|
|
|
|
|
|
|
|
|
|
|
|
|
|
|
|
|
|
|
|
| Gross margin % |
|
| 58.3 | % |
|
| 57.0 | % |
|
|
|
|
|
| 57.5 | % |
|
| 57.7 | % |
|
|
|
|
|
|
|
|
|
|
|
|
|
|
|
|
|
|
|
|
|
|
|
|
|
|
|
|
|
|
| Operating income % |
|
| 23.0 | % |
|
| 20.5 | % |
|
|
|
|
|
| 20.9 | % |
|
| 21.1 | % |
|
|
|
|
|
|
|
|
|
|
|
|
|
|
|
|
|
|
|
|
|
|
|
|
|
|
|
|
|
|
| GAAP diluted EPS |
| $ | 2.82 |
|
| $ | 1.53 |
|
|
| 84 | % |
| $ | 6.71 |
|
| $ | 5.04 |
|
|
| 33 | % |
| Pro forma diluted EPS (1) |
| $ | 1.72 |
|
| $ | 1.35 |
|
|
| 27 | % |
| $ | 5.59 |
|
| $ | 5.13 |
|
|
| 9 | % |
|
|
|
|
|
|
|
|
|
|
|
|
|
|
|
|
|
|
|
|
|
|
|
|
|
|
| (1) See attached Non-GAAP Financial Information for discussion and reconciliation of non-GAAP financial measures, including pro forma diluted EPS |
| |||||||||||||||||||||||