Power considerations in sub-micron digital CMOS
3.3. Fundamental limits
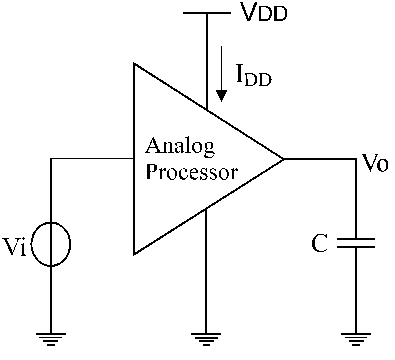
Fundamental limits for analog processing can be found from fig.3.3 where an analog processor is shown [2], [3]. This analog processor can be an amplifier, a filter, an oscillator etc. On the capacitor C there is a voltage VO with a peak-peak value Vpp. From the power supply is drawn a current with a mean value of IDD. Denote DQ the charge drawn from the power supply and f the frequency of the signal. Then, the total power P is:
 (3.8)
(3.8)
Power has a minimum when the peak-peak voltage on the capacitor Vpp has a value close to the power supply voltage. The capacitor C is charged and discharged from the
|
|
|
Fig.3.3: Analog processor |
power supply from a resistive path. The thermal noise generated by the resistive path will create noise on the capacitor but the band limiting action of the RC combination gives a finite contribution of noise on the capacitor, independent on the value of the resistor. The noise power on the capacitor is kT/C where k is the Boltzmann’s constant. The S/N ratio defined as the power of the signal over the power of the noise can be found from:
![]() (3.9)
(3.9)
Therefore, we can relate the power P to the S/N ratio in the following manner:
![]() (3.10)
(3.10)
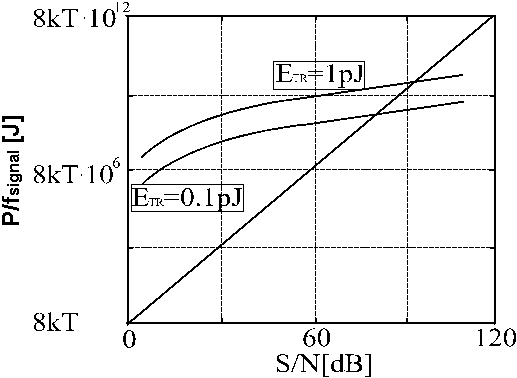
This absolute minimum of power predicts a ten fold increase of power for every 10 dB increase in signal to noise. In fig. 3.4 we have plotted on the same picture the power per frequency for a digital processor (see Chapter 2) and the power per frequency of an analog processor as a function of S/N ratio.
Comparisons between power consumption in analog versus digital, based on this figure will predict advantages of digital processors for large S/N ratios and advantages of analog processors for low S/N ratios respectively [2], [3]. Given the fact that energy per transitions in digital ETR decreases with the decrease of the feature size (see SIA roadmap from [11]), in future, digital processors are supposed to become more power efficient even for lower S/N ratios.
|
|
|
Fig.3.4: Fundamental power limits as a function of S/N |

