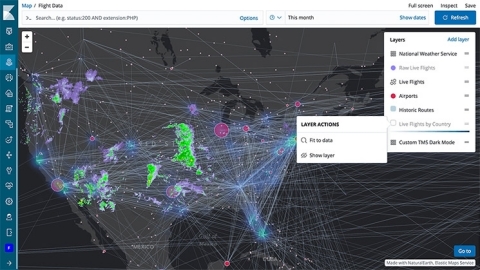
New Elastic Stack features and solutions expand Elastic’s data management capabilities and make it easier for users to consume and express their real-time data
MOUNTAIN VIEW, Calif. — (BUSINESS WIRE) — March 26, 2019 — Elastic N.V. (NYSE: ESTC), the company behind Elasticsearch and the Elastic Stack, announced the general availability of version 6.7 of the Elastic Stack. This release delivers two new solutions: Maps, for advanced, layered visualization of geospatial data on a map in Kibana, and Uptime, a new way to monitor system and service uptime with Elasticsearch and Kibana. Elasticsearch 6.7 also introduces the production-ready versions of many features, including cross-cluster replication, index lifecycle management, Elasticsearch SQL (including ODBC and JDBC clients), Canvas, and Functionbeat. Elastic Stack version 6.7 is available on Elasticsearch Service on Elastic Cloud, or users can download it for self-managed workloads.
This press release features multimedia. View the full release here: https://www.businesswire.com/news/home/20190326005906/en/

(Graphic: Business Wire)
Elastic Maps Brings New Layers to Geospatial Analytics in Kibana
Geo is an important part of search, whether you’re looking at logs to see where network traffic originates, answering questions like “How many taxis were available in the Chicago Financial District in the past 5 minutes?” or even correlating the magnitude and geographic reach of an earthquake with the scope of a network outage.
The Elastic Maps solution allows users to view and explore this location data in a more intuitive way. With features like multiple layers and plotting individual data points and shapes, with many options for customization, this solution improves on Elastic’s existing geospatial visualizations. Elastic Maps is launching in beta with the 6.7 release, and is included in Kibana by default, which means it's available today in Elastic Cloud.
Expanded Observability with the New Uptime Solution
The 6.7 release also introduces a new solution, Uptime, to proactively monitor systems, services, and APIs for expanded observability. The Uptime solution automatically detects when application services are down or are responding slowly, even before those services are called by the application, and provides proactive notifications.
Based on Heartbeat, a lightweight data shipper for uptime monitoring, Uptime can be deployed both inside and outside an organization’s network. It can be used to understand service uptime and response time characteristics from multiple network vantage points and to verify that services are available and returning the correct response codes. By combining the Uptime solution with logs, metrics, and APM data, users will be able to bridge data silos and speed up troubleshooting and root cause analysis across their observability initiatives.
Several Key Elastic Stack Features, Including SQL and Canvas, Graduate to GA Status in 6.7
With version 6.7, several popular Elastic Stack features are graduating to general availability (GA) status, marking them production-ready.
- Cross-cluster replication (CCR) gives users a self-contained mechanism to easily and reliably replicate indices from one cluster to another. Use cases for this popular feature include high availability/disaster recovery, geo proximity/data locality (replicating from a central cluster to local clusters so that the data is closer to the end user), and centralized search and analysis (replicating data to a central cluster for reporting and analysis against a single data source).
- Index lifecycle management (ILM) gives users a streamlined method to manage how Elasticsearch indices are stored and managed over time. Proper data management is critical to running a healthy, performant, and cost-efficient cluster, and this new feature greatly simplifies automating and operationalizing this important task. The lifecycle of an index is broken into four phases — hot, warm, cold, and delete — and users can define policies to control how long an index lives in each phase, as well as optimize for performance and/or cost-efficiency as the data ages.
- Elasticsearch SQL enables customers to use the familiar SQL syntax to query data in Elasticsearch. The introduction of this feature opens up the full-text powers, scale, and speed of Elasticsearch to a much wider audience that may already be well-versed in the SQL syntax and are just beginning their Elasticsearch journey. Also going GA are the JDBC and ODBC clients for Elasticsearch, which will let users connect to an Elasticsearch data backend from third-party tools that support these drivers.
- Canvas allows users to create dynamic infographic-style presentation with their live Elasticsearch data. It elevates the visual storytelling in Kibana to new heights, opening up your data analysis and insights to broader audiences. Canvas includes full support for Elasticsearch SQL, and just like JDBC and ODBC clients, it lets Elasticsearch users expand the reach and impact of their data to broader business audiences.
- Functionbeat is a new kind of Beat that deploys as a function in serverless computing frameworks, and streams cloud infrastructure logs and metrics into Elasticsearch. Functionbeat currently supports the AWS Lambda framework, and can stream data from CloudWatch Logs, SQS, Kinesis, and API gateways.
- The Elastic Logs solution provides users with real-time log tailing in a compact, customizable display. It’s similar to tailing a file, but with the ability to see the logs from all your infrastructure in a single streaming view. And with an embedded search bar powered by Elasticsearch, users can easily narrow the streaming view to just the logs they are looking for.
- The Elastic Infrastructure solution gives users a bird’s eye view of the health of all the components — servers, Kubernetes pods, Docker containers — in their infrastructure, making it easier to diagnose problems using log and metrics data. Building on the autodetect capabilities of Metricbeat, the tailored user interface allows you to interactively view and drill into the logs, metrics, and APM traces with a single click.

