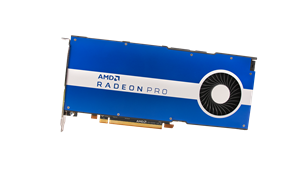
AMD RADEON™ PRO W5500 RESULTS:
AMD Radeon™ Pro W5500 SPECviewperf® 13 benchmark sw-04 viewset average test results score: 138.75 (est.)
AMD Radeon™ Pro W5500 with SPECviewperf® 13 benchmark sw-04 viewset test results score with Autodesk® 3ds Max® 2019 rendering an AMD internal engine 3d model at 1920 x 1080 with continuous iterations using the Arnold CPU renderer simultaneously average: 86.82 (est.)
Performance when multitasking: 100 + (86.82- 138.75)/138.75*100) = an estimated 62.57% of the workflow performance compared to the performance when not multitasking on the AMD Radeon™ Pro W5500 graphics card.
NVIDIA QUADRO® P2200 RESULTS:
NVIDIA Quadro® P2200 SPECviewperf® 13 benchmark sw-04 viewset average test results score: 139.76 (est.)
NVIDIA Quadro® P2200 with SPECviewperf® 13 benchmark sw-04 viewset test results score with Autodesk® 3ds Max® 2019 rendering an AMD internal engine 3d model at 1920 x 1080 with continuous iterations using the Arnold CPU renderer simultaneously average: 7.91 (est.)
Performance when multitasking: 100 + (7.91- 139.76)/139.76*100) = an estimated 5.66% of the workflow performance compared to the performance when not multitasking on the NVIDIA Quadro® P2200 graphics card.
Difference in performance while multitasking between the AMD Radeon™ Pro W5500 graphics card and the NVIDIA Quadro® P2200 graphics card (62.57/5.66)-1 = ~10.05x average better estimated application workflow performance for the AMD Radeon™ Pro W5500 graphics card.
Scores are based on AMD internal lab measurements and may vary. PC manufacturers may vary configurations, yielding different results. Performance may vary based on use of latest drivers. RPW-274
4 Testing conducted by AMD Performance Labs as of January 2020, on a test system comprising of an Intel® Xeon® W-2125 4-core 4.50 GHz CPU, 32 GB RAM, Windows® 10 for Workstations 64-bit October 2018 Update, System BIOS 1.11.1 at default settings, Radeon™ Pro WX 9100, AMD Radeon™ Pro Software for Enterprise 20.Q1/AMD Radeon™ Pro Software for Enterprise 19.Q1.
Benchmark Application: ran the SPECviewperf® 13 benchmark and then calculated the geomean of all viewsets (higher is better).
AMD Radeon™ Pro Software for Enterprise 20.Q1: 147.64 (est.).
AMD Radeon™ Pro Software for Enterprise 19.Q1: 127.88 (est.).
Performance Differential: (147.64-127.88)/127.88*100 = ~15.45% better estimated performance with AMD Radeon™ Pro Software for Enterprise 20.Q1 on the Radeon Pro WX 9100 graphics card.
Scores are based on AMD internal lab measurements and may vary. PC manufacturers may vary configurations, yielding different results. Performance may vary based on use of latest drivers.
RPS-118
5 Compatible with AMD Radeon™ Pro WX 3200, WX 4100, WX 5100, WX 7100, WX 8200, WX 9100, W5700 and W5500 GPUs. Remote Workstation functionality requires AMD Radeon™ Pro Software for Enterprise driver 18.Q4 or newer plus purchase and installation of Citrix Virtual Apps & Desktops™ or Microsoft® Remote Desktop Services. RPS-50
A photo accompanying this announcement is available at https://www.globenewswire.com/NewsRoom/AttachmentNg/94cb33aa-068e-4124-a4e3-02f5fef86274


